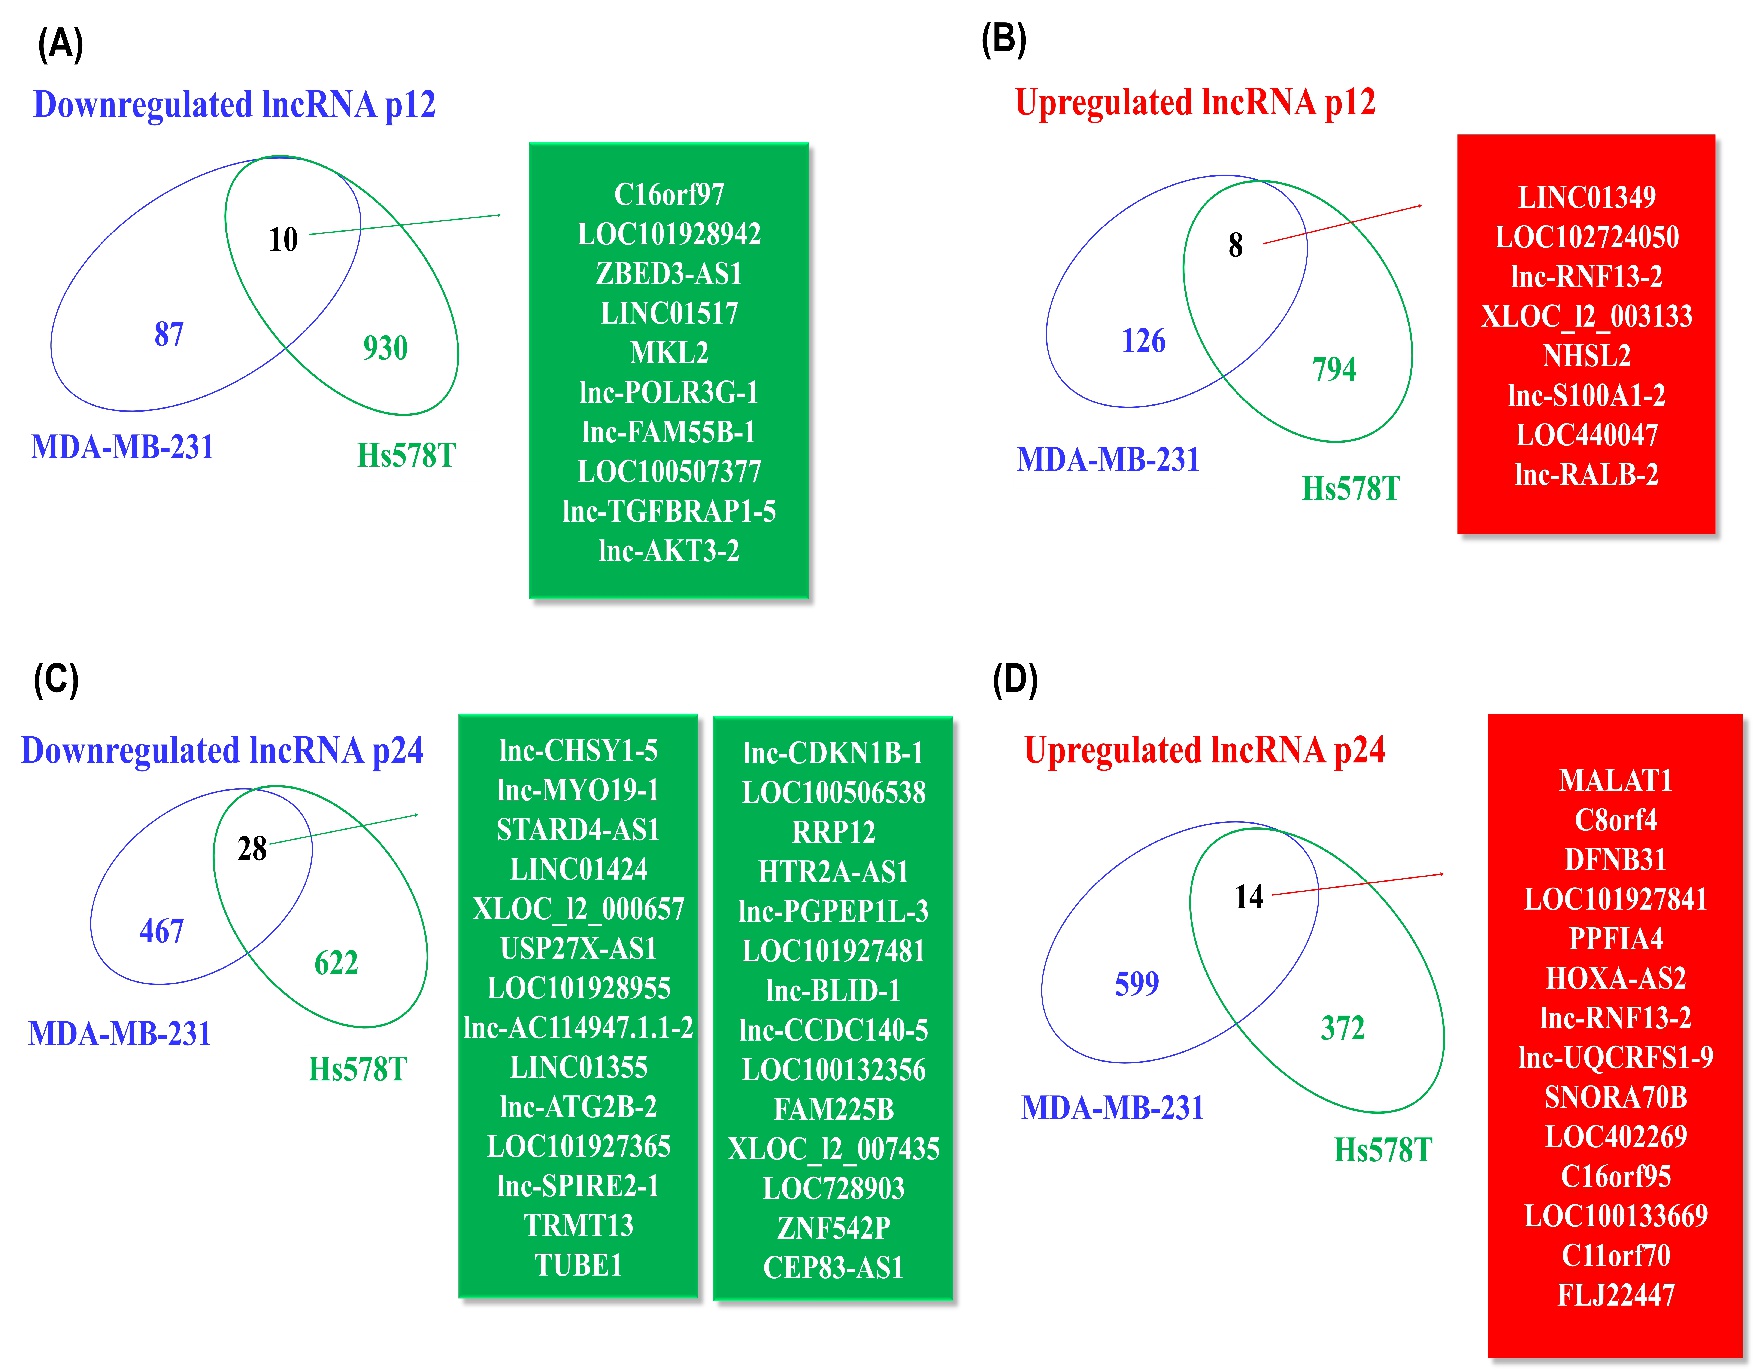
Fig. 6. Alteration of lncRNAs in TNBC cell lines as effect of multiple dose exposure to paclitaxel therapy on selected TNBC cell lines. Venn diagram of the statistically significant (FC ± 2 and p-value ≤ 0.05) upregulated and downregulated lncRNAs by overlapping both TNBC cell lines; (A, C) Common downregulated lncRNAs signature at P12, respectively P24; (B, D) Common overexpressed lncRNAs signature at P12, respectively P24.